Note
Go to the end to download the full example code. or to run this example in your browser via Binder
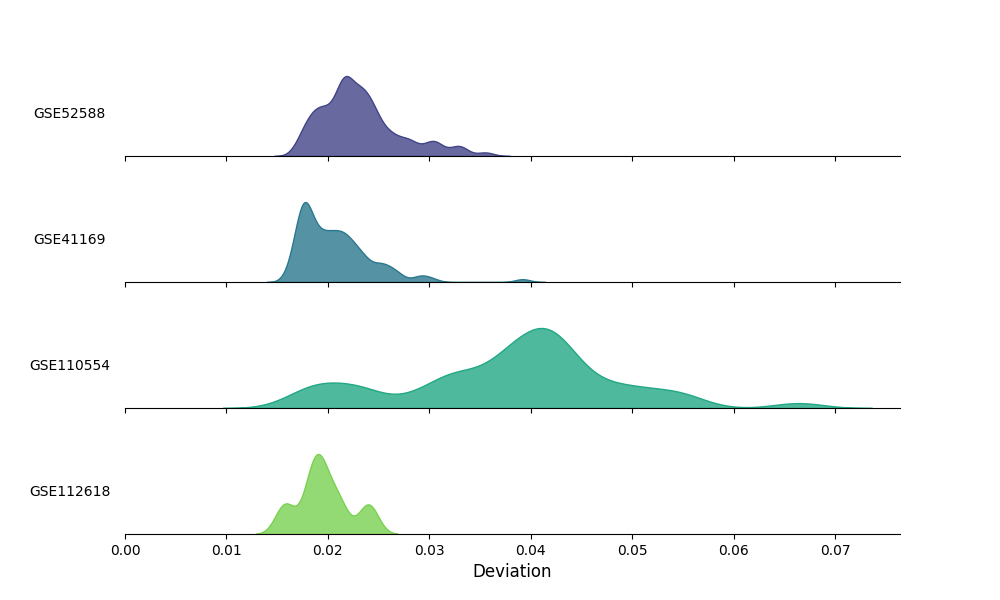
Quality control visualization using GEO datasets
This example demonstrates the built-in quality control plotting function to visualize the distribution of sample deviations from the population mean in a ridge density plot.
Import required classes and functions
from biolearn.data_library import DataLibrary, GeoData
from biolearn.visualize import plot_sample_deviations
Create a dictionary of dataset display names to GeoData objects
library = DataLibrary()
dataset_ids = ["GSE112618", "GSE110554", "GSE41169", "GSE52588"]
datasets = {id: library.get(id).load() for id in dataset_ids}
Generate a quality control report for each dataset
[dataset.quality_report().show() for dataset in datasets.values()]
Quality Report Summary

------------------------------------------------
Sample Count: 6
Methylation Sites: 866091
Missing Methylation Data: 0 (0.00%)
Samples With High Deviation: 0 (0.00%)
Methylation Sites With Over 20% of Reads Missing: 0 (0.00%)

Notes:
------------------------------------------------
- No missing data points implies that this data has already gone through an imputation process or that low quality reads were included.


Quality Report Summary

------------------------------------------------
Sample Count: 49
Methylation Sites: 866091
Missing Methylation Data: 0 (0.00%)
Samples With High Deviation: 24 (48.98%)
Methylation Sites With Over 20% of Reads Missing: 0 (0.00%)

Notes:
------------------------------------------------
- No missing data points implies that this data has already gone through an imputation process or that low quality reads were included.
- Your data set includes samples with a high deviation. It is likely that the methylation data for these samples has been distorted due to technical issues.


Quality Report Summary

------------------------------------------------
Sample Count: 95
Methylation Sites: 485577
Missing Methylation Data: 60482 (0.13%)
Samples With High Deviation: 0 (0.00%)
Methylation Sites With Over 20% of Reads Missing: 5 (0.00%)

Notes:
------------------------------------------------
- Your data set includes methylation sites that have over 20% of reads missing. Default imputation may replace the values for all reads from this site with a gold standard.


Quality Report Summary

------------------------------------------------
Sample Count: 87
Methylation Sites: 485577
Missing Methylation Data: 27449 (0.06%)
Samples With High Deviation: 0 (0.00%)
Methylation Sites With Over 20% of Reads Missing: 7 (0.00%)

Notes:
------------------------------------------------
- Your data set includes methylation sites that have over 20% of reads missing. Default imputation may replace the values for all reads from this site with a gold standard.


[None, None, None, None]
Visualize the distribution of sample deviations from the population mean
Total running time of the script: (0 minutes 23.927 seconds)
Estimated memory usage: 1997 MB