Note
Go to the end to download the full example code. or to run this example in your browser via Binder
“Transcriptomic Clock” using GEO Data
This example loads transcriptomic data from GEO, calculates the predicted age using a transcriptomic clock, and plots it against chronological age.
First load up some transcriptomic data from GEO using the data library
from biolearn.data_library import DataLibrary

data = DataLibrary().get("GSE134080").load()
Now run the transcriptomic clock to predict age
from biolearn.model_gallery import ModelGallery

rna_model = ModelGallery().get("TranscriptomicPredictionModel", imputation_method="none")
predicted =  rna_model.predict(data)
Plot the results against the chronological age using seaborn
import matplotlib.pyplot as plt
import seaborn as sns
from scipy.stats import pearsonr

predicted_values = predicted['Predicted']
true_values = data.metadata['age']

correlation, _ = pearsonr(true_values, predicted_values)
print(f"Pearson Correlation Coefficient: {correlation}")

sns.set_theme(style="whitegrid")
sns.regplot(x=true_values, y=predicted_values, scatter_kws={'alpha':0.5})
plt.title('Transcriptomic Prediction Model')
plt.xlabel('Chronological Age')
plt.ylabel('Transcriptomic Age')
plt.show()
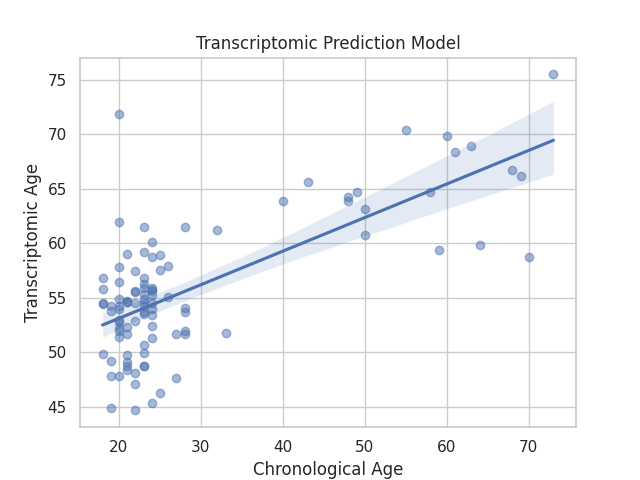
Pearson Correlation Coefficient: 0.7025211774998293
Total running time of the script: (0 minutes 11.059 seconds)
Estimated memory usage: 698 MB