Note
Go to the end to download the full example code. or to run this example in your browser via Binder
“Deconvolution Example”
This example loads blood DNA Methylation data from GEO, estimates the proportion of cell types, and compares them to known cell type proportions.
Load GEO blood methylation dataset measured on EPIC platform
from biolearn.data_library import DataLibrary

epic_facs_salas_18 = DataLibrary().get("GSE112618").load()
Estimate cell proportions using EPIC deconvolution model
from biolearn.model_gallery import ModelGallery
gallery = ModelGallery()

epic_facs_cell_prop = gallery.get("DeconvoluteBloodEPIC").predict(epic_facs_salas_18)
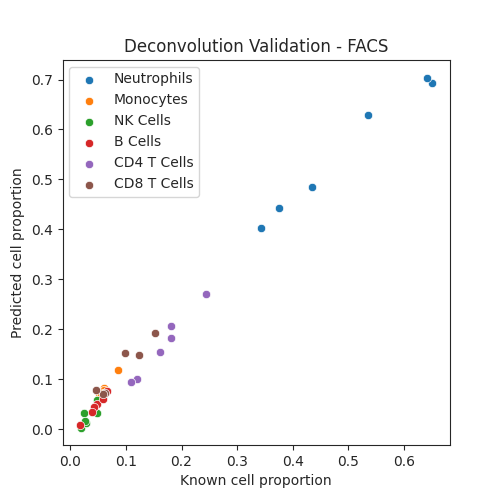
Compare to known cell proportions measured with FACS (fluorescence-activated cell sorting)
import seaborn as sns
import matplotlib.pyplot as plt

sns.set_style("ticks")
plt.figure(figsize = (5, 5))

sns.scatterplot(x = epic_facs_salas_18.metadata.neutrophils_proportion.astype(float), y = epic_facs_cell_prop["neutrophil"])
sns.scatterplot(x = epic_facs_salas_18.metadata.monocytes_proportion.astype(float), y = epic_facs_cell_prop["monocyte"])
sns.scatterplot(x = epic_facs_salas_18.metadata.nk_proportion.astype(float), y = epic_facs_cell_prop["nk_cell"])
sns.scatterplot(x = epic_facs_salas_18.metadata.bcell_proportion.astype(float), y = epic_facs_cell_prop["b_cell"])
sns.scatterplot(x = epic_facs_salas_18.metadata.cd4t_proportion.astype(float), y = epic_facs_cell_prop["cd4_t_cell"])
sns.scatterplot(x = epic_facs_salas_18.metadata.cd8t_proportion.astype(float), y = epic_facs_cell_prop["cd8_t_cell"])

plt.legend(["Neutrophils", "Monocytes", "NK Cells", "B Cells", "CD4 T Cells", "CD8 T Cells"])
plt.xlabel("Known cell proportion")
plt.ylabel("Predicted cell proportion")
plt.title("Deconvolution Validation - FACS")
Text(0.5, 1.0, 'Deconvolution Validation - FACS')
Total running time of the script: (0 minutes 11.322 seconds)
Estimated memory usage: 598 MB