Note
Go to the end to download the full example code. or to run this example in your browser via Binder
Down Syndrome Epigenetic Plotting
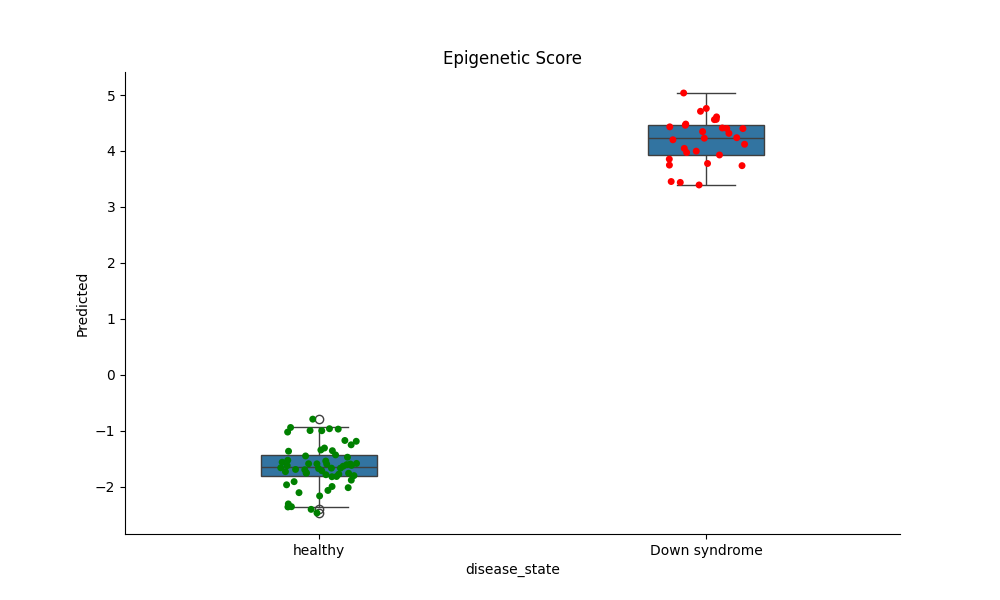
This example loads a DNA Methylation data from GEO with down syndrome metadata and shows how the sameples can be distiguished with epigenetic data
First load up some methylation data from GEO using the data library
from biolearn.data_library import DataLibrary
test_data = DataLibrary().get("GSE52588").load()
Now run the down syndrome model on the data to get a score
from biolearn.model_gallery import ModelGallery
model = ModelGallery().get("DownSyndrome")
results = model.predict(test_data)
Finally generate a boxplot to show the predictive power
import matplotlib.pyplot as plt
import seaborn as sns

# Set index for merging
results.set_index(results.index.astype(str), inplace=True)
test_data.metadata.set_index(test_data.metadata.index.astype(str), inplace=True)

# Merge data
merged_data = results.join(test_data.metadata)

# Plot settings
category_order = ['healthy', 'Down syndrome']
palette = {'healthy': 'green', 'Down syndrome': 'red'}
title = 'Epigenetic Score'

# Create and configure the plot
plt.figure(figsize=(10, 6))
ax = sns.boxplot(x='disease_state', y='Predicted', data=merged_data, width=0.3, order=category_order)
sns.stripplot(x='disease_state', y='Predicted', data=merged_data, jitter=True, palette=palette, order=category_order, hue='disease_state', dodge=False, legend=False)
ax.set_title(title)
sns.despine()
plt.show()

Total running time of the script: (0 minutes 12.088 seconds)
Estimated memory usage: 194 MB