Note
Go to the end to download the full example code. or to run this example in your browser via Binder
DNA methylation visualizations using GEO datasets
This example demonstrates the built-in DNA methylation plotting function to visualize DNA methylation against age across datasets in a violin and linear and polynomial regression plots.
Import required classes, and functions
from biolearn.data_library import DataLibrary
from biolearn.visualize import (
    identify_stable_cpg_sites,
    compute_age_group_stats,
    compute_methylation_stats,
    plot_methylation_by_age_sex,
    plot_methylation_vs_age
)
Load GEO methylation dataset(s) and set up objects for visualization function use
# List dataset IDs
dataset_ids = ["GSE112618", "GSE110554", "GSE41169", "GSE52588"]

# Load datasets into a dictionary of GeoData objects
library = DataLibrary()
datasets = {id: library.get(id).load() for id in dataset_ids}
Identify the top 10 stable CpG sites with low variance for each dataset
stable_sites = identify_stable_cpg_sites(datasets, threshold=0.01)
for dataset in stable_sites:
    dataset_name = dataset["Dataset"]
    stable_cpg_sites = dataset["Stable CpG Sites"][:10]
    print(f"{dataset_name}: {stable_cpg_sites}")
GSE112618: ['cg00000029', 'cg00000103', 'cg00000109', 'cg00000155', 'cg00000158', 'cg00000165', 'cg00000221', 'cg00000236', 'cg00000289', 'cg00000292']
GSE110554: ['cg00000103', 'cg00000109', 'cg00000155', 'cg00000158', 'cg00000165', 'cg00000221', 'cg00000289', 'cg00000292', 'cg00000321', 'cg00000363']
GSE41169: ['cg00000029', 'cg00000108', 'cg00000109', 'cg00000165', 'cg00000236', 'cg00000289', 'cg00000292', 'cg00000321', 'cg00000363', 'cg00000622']
GSE52588: ['cg00000029', 'cg00000108', 'cg00000109', 'cg00000165', 'cg00000236', 'cg00000289', 'cg00000292', 'cg00000321', 'cg00000363', 'cg00000622']
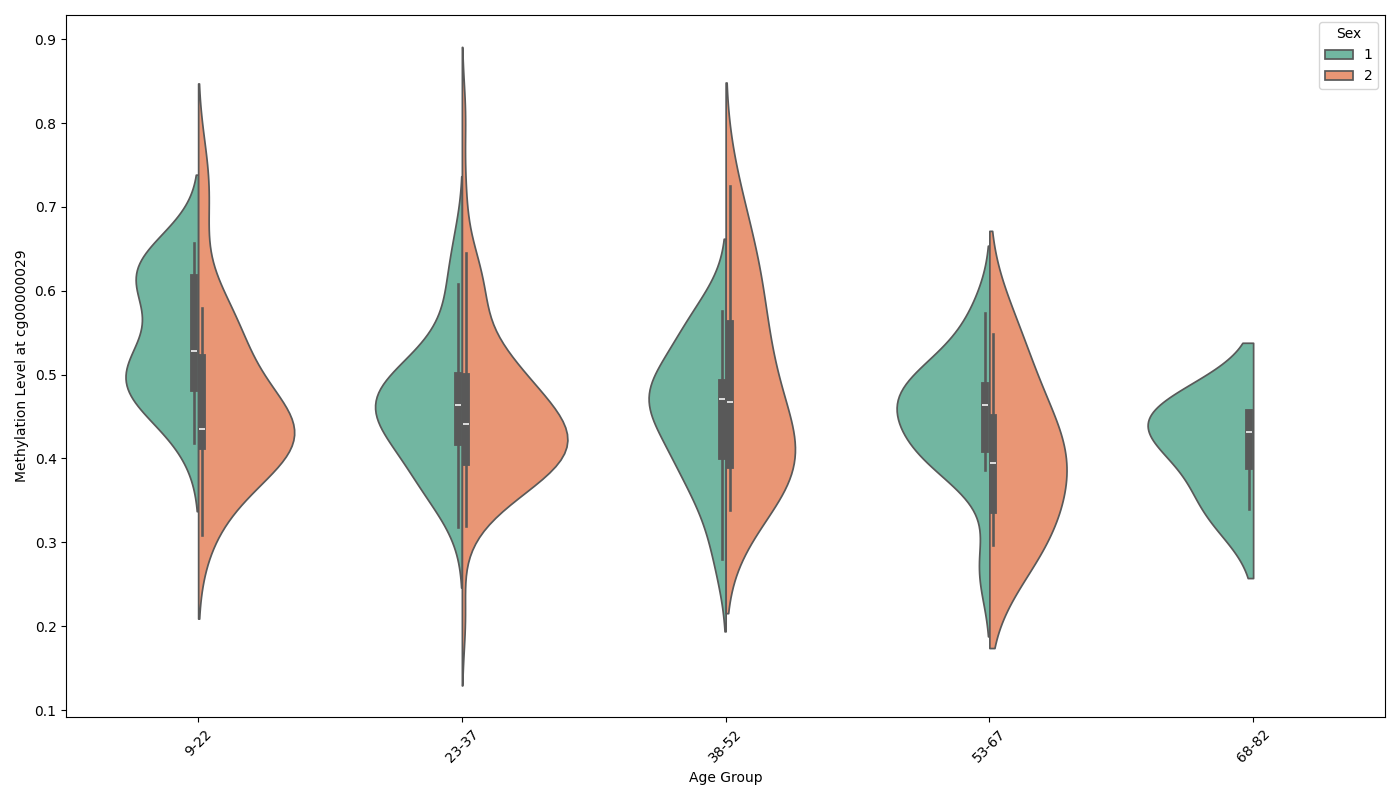
Visualize DNA methylation levels by age and sex in a violin plot
# Initialize an appropriate CpG site
cpg_site = "cg00000029"

# Compute statistics by age group for the specified CpG site
stats_df, combined_data1 = compute_age_group_stats(datasets, cpg_site, age_bins=5)

# Plot DNA methylation levels by age group and sex across datasets in a violin plot
# Note: In the datasets, '1' represents Female and '2' represents Male.
plot_methylation_by_age_sex(combined_data1, cpg_site)
Visualize DNA methylation against age with linear and polynomial regression
# Compute regression statistics to plot methylation vs. age
combined_data2, stats_df = compute_methylation_stats(datasets, cpg_site)

# Plot DNA methylation against age across datasets with linear and polynomial regression lines
plot_methylation_vs_age(combined_data2, stats_df, cpg_site)
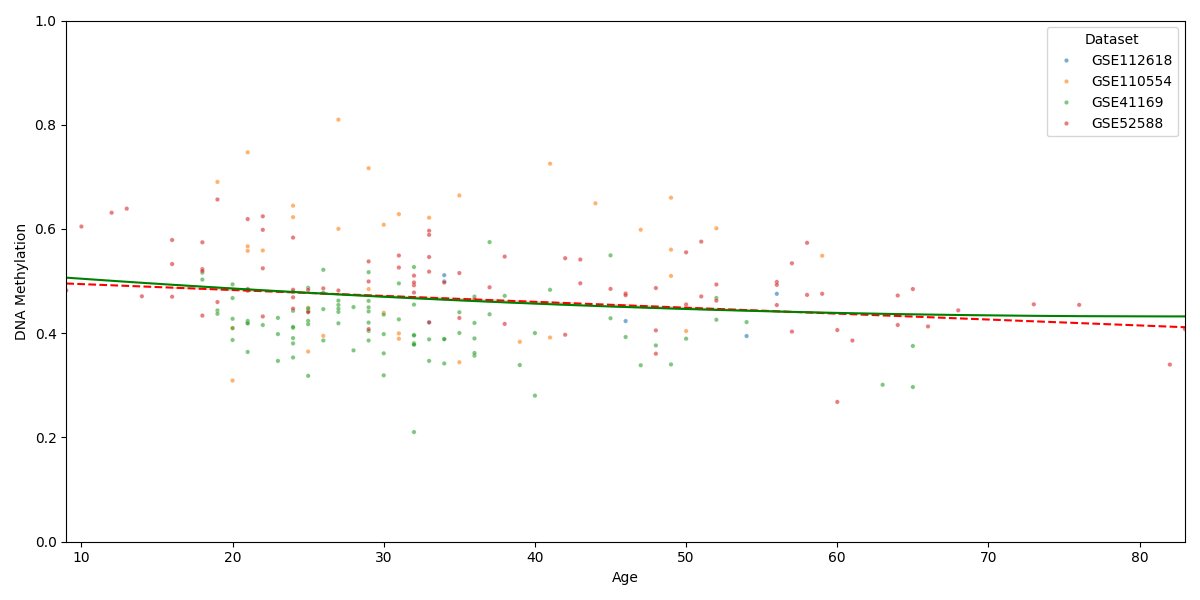
Computed statistics for CpG site: cg00000029
Linear Regression R^2: 0.0311
Pearson Correlation (r): -0.1764
Pearson Correlation p-value: 8.2813e-03
Polynomial Regression (Degree 2) R^2: 0.0327
Total running time of the script: (0 minutes 15.221 seconds)
Estimated memory usage: 292 MB